By Cynthia Walker, CEO
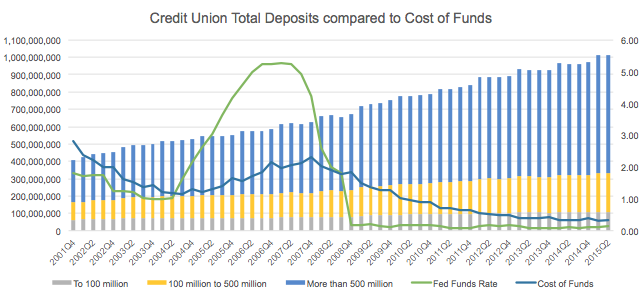
“CU Savings Balances Top $1 Trillion” headlined a report from CUNA Mutual1 on May 18 of this year. Their report also indicated total credit union membership in the U.S. is estimated at 103 million, or 32.5% of the total population of the country. With the June 2015 Call Report data now available, I decided to do a little analysis and chart the trends and growth patterns of deposits along with the Federal Funds rate and credit union cost of funds. Below is a graph and a recap of the results.2
From 2001 to September 2008 total growth in deposits averaged 7.3% annually. Further analysis showed credit unions with assets less than $100 Million experienced 3.7% growth and credit unions in the asset class of $100 Million to $500 Million experienced 6.1% growth.
Seven years ago, George W. Bush signed into law the “Emergency Economic Stabilization Act of 2008” which temporarily increased federal deposit insurance coverage to $250,000.3 This was later made permanent through the Dodd-Frank Wall Street Report and Consumer Protection Act of 2010. I have often wondered if the increase in insurance coverage affected deposit growth. After the increase in coverage total credit union deposits grew 6.5% annually. Broken down by asset class, credit unions smaller than $100 Million experienced 4.7% growth and credit unions with assets from $100 Million to $500 Million showed 5.8% growth. Based on these numbers it does not appear the change in insurance coverage influenced growth trends significantly. Neither did increases or decreases in market rates seem to have an impact or correlation to overall balances or growth trends.
Several past articles in the Mark H. Smith, Inc. newsletters have focused on deposits. Knowing the deposit composition and behavior is very important when estimating interest rate risk. A majority of credit unions have a solid understanding of the behavior of the assets on their balance sheet because most of them are backed by a contractual agreement. The asset composition is shifting slightly and NCUA recently commented “As credit unions continued their efforts to prepare for interest rate risk, the system’s net long-term assets ratio fell to 32.6% in the second quarter of 2015. Credit unions with less than $10 million in assets had the lowest net long-term asset ratio of any peer group at 11%. In comparison, credit unions with more than $500 Million in assets had a ratio of 33.6%.”4
When modeling and forecasting interest rate risk, non-maturity shares assumptions are a significant component of the analysis and also require the most guesswork. I feel the strong growth in deposits over the last 15 years depicted in the graph above, combined with the following statements, support the strength and continued growth in credit unions future deposits:
Across America, there’s a growing recognition that credit unions offer solid value to their members. More people see credit unions as an affordable financial services alternative. Credit unions continue to increase lending while taking steps to shed certain investments that would pose risk when interest rates inevitably begin to rise. All these trends are signs of a robust system.”
This was in a recent statement issued by NCUA Chairman Debbie Matz/
Consumer Reports has ranked the best and worst industries and companies for customer service, and credit unions have come out on top. Their survey rates credit unions No. 1 for service, scoring CUs 90 out of 100. The results are based on surveys collected over the last three years. Industries are scored on a scale from zero to 100, with 100 being perfect customer service.6
My Conclusions:
In the environment of swirling negativity and doom and gloom mentality, stay positive and focus on what credit unions do best. When preparing for interest rate changes and estimating possible exposure, look at the industry trends and your credit union’s own trends. Based on what has occurred with deposit growth, combined with realistic rate sensitivities, an increase in interest rates may benefit your credit union’s overall financial performance. It can be very frustrating when regulatory emphasis is placed on risk avoidance rather than risk management. When managing from the perspective of risk avoidance forecasts in the rate up scenarios are often negative. However, when deposit behaviors are evaluated and understood as much as possible, then credit unions can create more meaningful interest rate risk analysis and the results are often not as bleak. Be prepared to have these discussions with your management team and also your examiner. I feel the above statements and graph support the utilization of realistic and stable deposit assumptions.
Sources:
1 – http://www.cutoday.info/Fresh-Today/CU-Savings-Balances-Top-1-Trillion
2 – https://www.snl.com/InteractiveX/
3 – http://www.ncua.gov/Legal/GuidesEtc/GuidesManuals/NCUAHowYourAcctInsured.pdf
4 – http://www.cutoday.info/Fresh-Today/Consumer-Reports-Rates-Credit-Unions-Highest-For-Service

