By Cynthia R. Walker, CEO
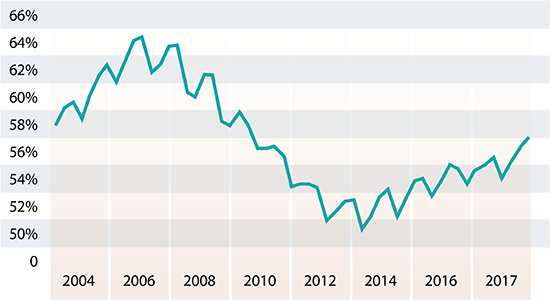
Credit unions in the asset range of 10 million to 250 million have seen their loan to total asset ratios increase in the last 5 years from a low of 49% to a ratio of 55% as of December 2017.
Mark H. Smith, Inc. Peer Analysis Balance Sheet Module
While this is a very nice improvement, it still leaves a sizable portion of the balance sheet residing in investments and other assets. Maximizing earnings while balancing interest rate risk is the essence of asset liability management and the investment portfolio continues to be an important component in a credit union’s overall profitability.
I would like to share the success one credit union had as they made some significant shifts in their investment strategies. To start, here are a few stats about this credit union: over $100 million in total assets, net worth ratio 10% plus, loan to asset ratio 64%, overnight liquidity ratio 19%, and 1-year liquidity ratio 22%. Their ROA for 12 months ending March 2015 was a modest 19 bps.
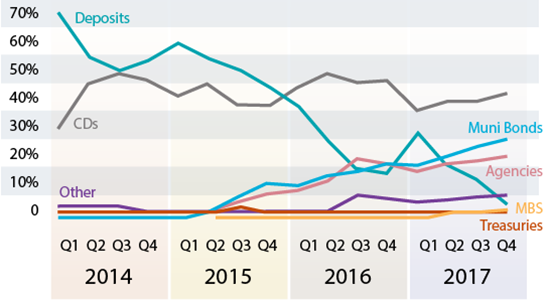
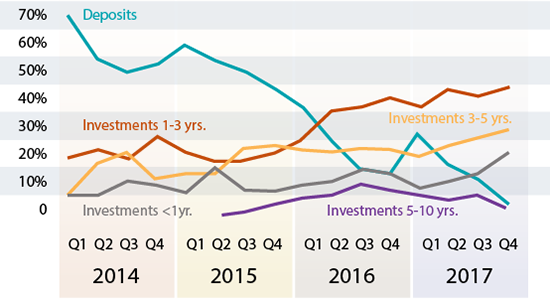
Early in 2015, this credit union made a conscious decision to restructure their investment portfolio and move assets that were in overnight accounts and a few investment CDs into longer-term investments with better yields. They also shifted their term investments from exclusively investment CDs into a mix of CDs, government agencies bonds, and muni bonds. With this shift, the credit union’s interest rate risk increased but remained well within acceptable risk limits. The overall benefit to income was worth the increased risk.
Before the transition, which took up to 15 months, the credit union’s interest on investments represented 21 basis points. At the end of the 15 months, their interest on investments grew to 39 basis points and set them on the path for continued improvement in investment interest income. From June of 2016 to June of 2017, investment income increased to 45 basis points. A 24 basis points increase equates to $240,000 annually for a credit union with total assets of $100 million. With assets of $50 million it would be $120,000 annually. If nothing else changed in income or expenses, the ROA would improve from 19 basis points to 43 basis points. For many credit unions in the asset range less than $150 million, additional income of this amount is not trivial.
Now the questions are, how long did they invest and what did this do to their interest rate risk? During this analysis period, it should be noted the credit union’s investment portfolio stayed consistent and continued to be very close to 30% of total assets. The investment terms did not exceed 72 months and the majority were in instruments with maturities of 60 months or less. They also appropriately laddered the maturities for liquidity. The improved earnings resulted in the net worth ratio increasing.
Before these changes, the credit union’s NII at risk in the up-rate shock of 300 bps was a positive 27.5% for the three-year cumulative and a positive 9.5% in year one. Their very low level of interest rate risk can be attributed to a one-year liquidity ratio of over 20% combined with 37% of their funding in lower rate sensitive regular shares and share draft accounts. The NEV analysis produced similar results with strong positive numbers and indicated little to no interest rate risk.
Mark H. Smith, Inc. Peer Analysis Balance Sheet Module
Mark H. Smith, Inc. Peer Analysis Balance Sheet Module
At the end of 2017, the interest rate risk profile in the up 300 basis point scenario estimated the NII at risk at a positive 4.1% in the three-year cumulative and forecasted a decrease in NII of 9.7% in the first year. The base case net interest margin in 2017 was stronger than it was in 2015 and easily absorbed the forecasted decline in the first year. The subsequent years indicated positive increases in NII over the base case scenario. Again, the NEV analysis yielded similar results with net worth at risk of a positive 8.6% and a strong market adjusted net worth ratio. The NCUA supervisory test results remained well within the low-risk range.
How does this case study help you as the reader? It is intended to promote questions and cause the reader to take a moment to reflect on your credit union’s balance sheet composition and investment strategies. Even during this time when fed fund rates are projected to increase 75 basis points in the next 9 to 12 months, there may be options for improving the performance of the investment portion of your balance sheet. Evaluate the benefits of investing now versus sitting on the sidelines until the up rate cycle ends. Review your interest rate risk profile and determine if there is an opportunity to improve earnings now, even as rates are increasing, and still keep your interest rate risk within policy limits and at a level your credit union management and board are comfortable with.


